INTRODUCTION TOP
The
Grid is a way of recording and reporting on CAF subjects such as Interactive
Media, Senior Science, VET subjects, Maths in Practice etc.
The Grid is available for each year 11&12 CAF subject and is purchased
for each subject.
The Grid will allow you to enter student names and the marks for each outcome
on each task. This is done using a grid pattern that represents the outcomes
available for each task. Staff can enter the values in through the keyboard
or use the available dropdown list that appears as marks are entered into
the grid.
A grade is generated as the marks are entered into the grid. The final mark
for each outcome is also generated on the fly.
When the marks are entered into the Grid the staff member then has a variety
of ways of viewing the data.
Staff can view the data as a class list for each task. This has the benefit
of showing that students have not handed in work, of showing patterns for
the teacher in what outcomes have been covered well and it is also useful
as a means for comparing classes for the same subject.
Staff can also view the final outcomes as a class list, which also has a grade
attached to the list. Again, useful for reflective teaching, staff meetings
and reporting to the HOD. This list can also assist in determining who is
the top student in the class.
Staff can generate class photos, especially useful for the beginning of the
year when you are unsure of all your students’ names.
Staff can generate reports for each task indicating what each student gained
for that task, a description of the outcome and a comment.
All reports can be printed onto pre-printed letterheads or standard blank
A4 sheets with the school logo, subject details and school details already
entered into the program. These details can be adjusted at any time to represent
change within the subject/department or school details.
Staff can generate interim reports that report on the outcomes being covered
and where each student is in relation to that outcome. Outcomes that have
not been covered by time the interim report is sent out are indicated as “Not
Assessed” for each student. The interim report also allows you to address
certain behaviours in the classroom and attendance issues. The interim report
can also be set up as a normal report with options to adjust what appears
in the report set-up. The interim report also has a facility for comments.
Staff can generate a final report showing the overall mark with outcomes allocated
and with a final grade. The final grade can be overwritten as a “U”
if the student has not attempted or handed in all work.
Staff can keep track of what the students have handed in and whether it was
on time etc. This feature is purely for the teachers benefit and is not reported
on at this stage and is available through the main screen.
The outcomes are already installed into the program but may be adjusted at
any time by the staff member to reflect their classroom. Usually this is left
untouched to coincide with Curriculum Council requirements, but the option
is there.
The task descriptions are also available for the staff to change. These adjustments
are seen when the reports are printed and appear at the top of each report.
The software will run on Macintosh’s and PC’s as a standalone
application.
Example of entering data TOP
Launch the program by double clicking on one of the appropriate icons on your computer. The PC version will have the '.EXE' on the end indicating that it is the EXEcutable that you need to run.
| Macintosh Launch |
|
| PC Launch |
|
Once launched you will be presented with the following screen. This is the main screen where you can enter a students complete set of marks into the outcomes Data Fields. These produce dropdown lists that work quickest with the appropriate letter (V,H,S,N) and the return/enter key
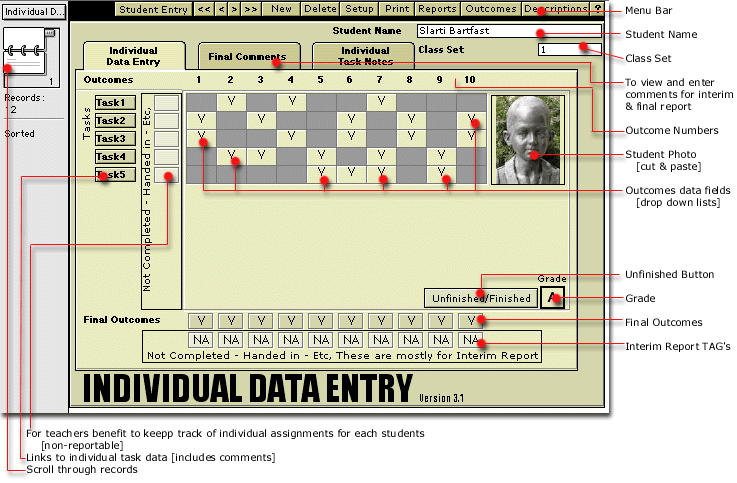

Main Screen Fig 1 & 1a
Entering a new student TOP
To enter a new student onto the system you need to select the 'Student Entry' button on the menu bar
![]()
Student Entry Button Fig 2
This will provide you with the following screen
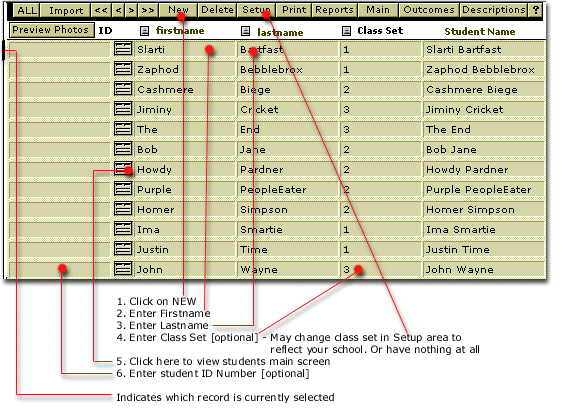
Follow
the steps in Fig. 3 to add students to the list. You will find it useful to
use the TAB key to go from firstname – to – lastname – to
– class set.
Please note how a record is currently selected by the black bar on the side.
This means that when you press the icon as indicated in step 5 you will be
taken to the main screen for that student.
Once you have entered all of your students You may return to the main screen
and enter the data for the appropriate student.
Use the delete button to delete any current students, be sure to have the
black bar on the right student before you delete as the software is designed
to save as you go. You will only be able to use 1 undelete from the edit menu.
You may cycle through the class list using either arrows or flip book
|
|
OR |
|
| Arrows fig 4 |
Flip Book fig 5 |
There are a couple of other places you can enter outcome data:
| Individual
data screen |
|
Class list reports
|
|||
| Fig6 |
|
Fig 7 |
Fig.
7 offers the quickest way to enter a class set of data for a specific task.
When there the screen will look like this:
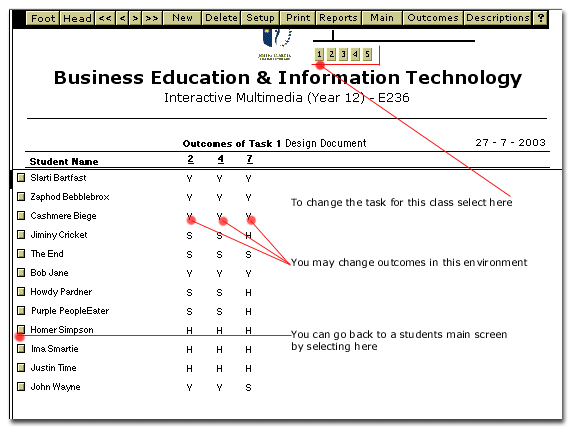
Fig 8
You would find using the tab key beneficial here to go from outcome to outcome. You will need to use your mouse to go from student to student however.
You
will find it easier to enter a class set from the bottom up as the dropdown
menu can get in the way if you are going from top to bottom. Going this way
will make it quicker by using the mouse, going from outcome to outcome and
student to student.
If you have gone to the individual data entry screen (fig 6) to enter outcome data, select a task button to see the following screen:
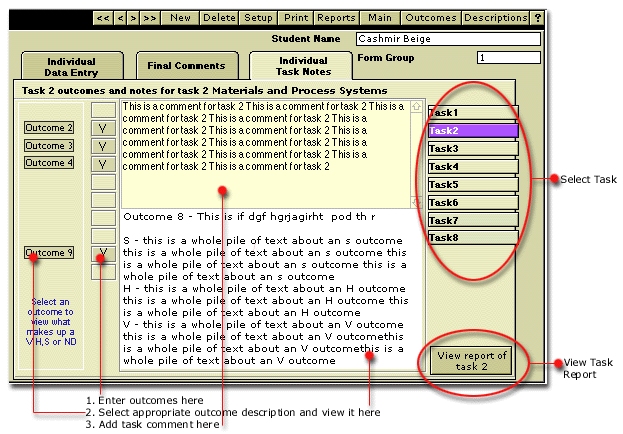
fig. 9
Please
note the instructions indicated by ![]() .
.
This covers the basics for entering student details and outcome data for each student.
Now
we will look at some of the other features available within the software.
There are a variety of reports that you have at you disposal. They are:
The links to these reports can be found by clicking on the report button on the Menu Bar
![]()
From here you will see:

Fig 10
Fig. 10 gives you the links to individual task reports for a student. You cannot change any data in these reports.

fig 11
Fig. 11 gives you the links to class list reports for each task. You can only change the outcomes in these reports.

fig 12
Fig. 12 gives you 5 different reports ranging from a class list of final outcomes through to a “Final Grid Report”, “Full set of Comments” report, class “Photos” report and “Interim report”. You can adjust details in the “Interim Report” and outcomes in the “Final Grid with Comment” report, but not in any of the others.
Class list report on a task

Fig 13
Individual Task report TOP
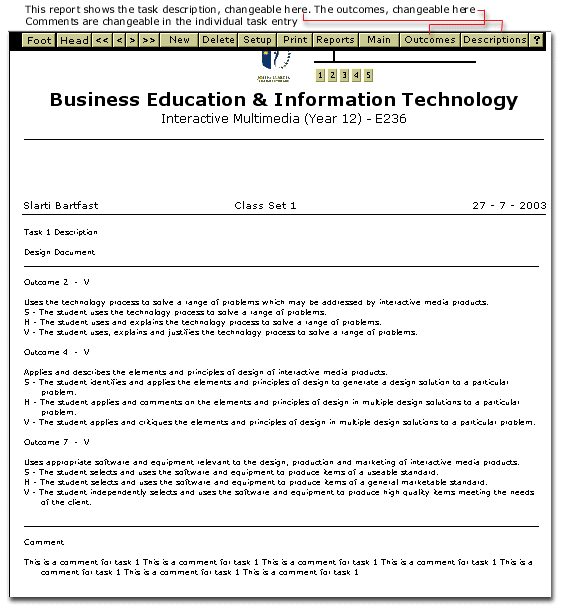
Fig 14
Final outcomes with grade TOP
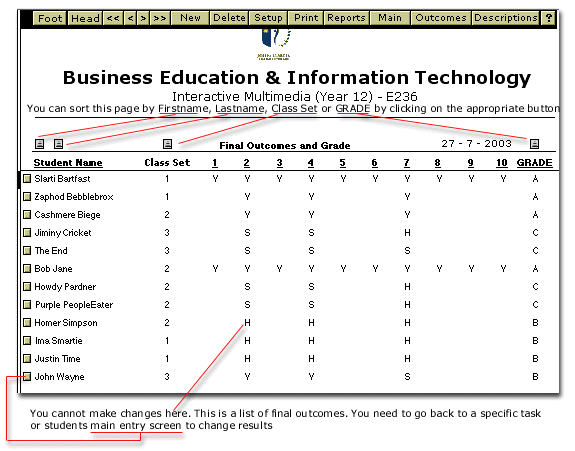
fig 15
Final grid with comment TOP
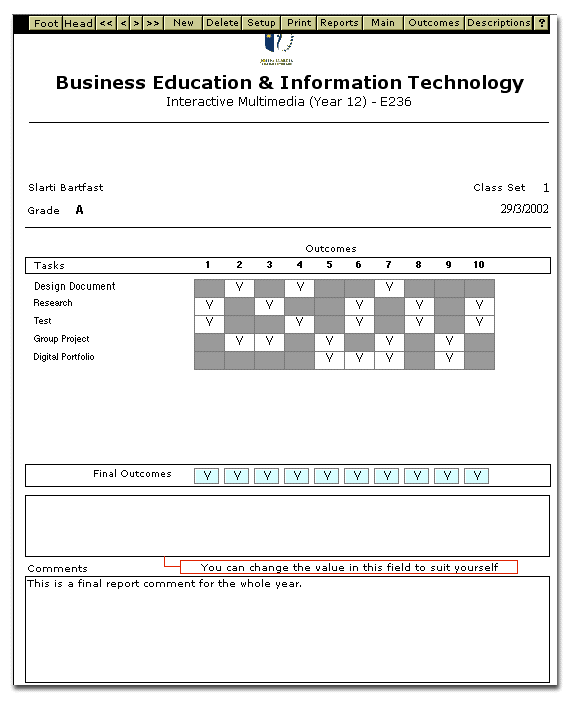
Fig 16
Full set of comments TOP

Fig 17
Photos TOP
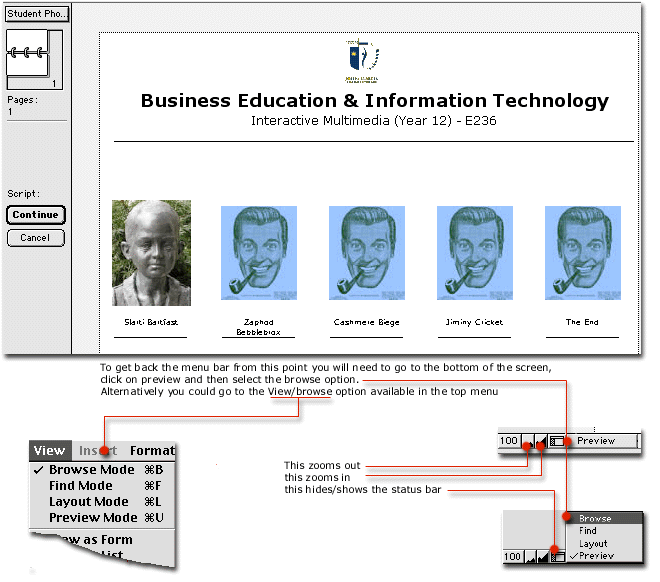
fig 18
Interim report TOP
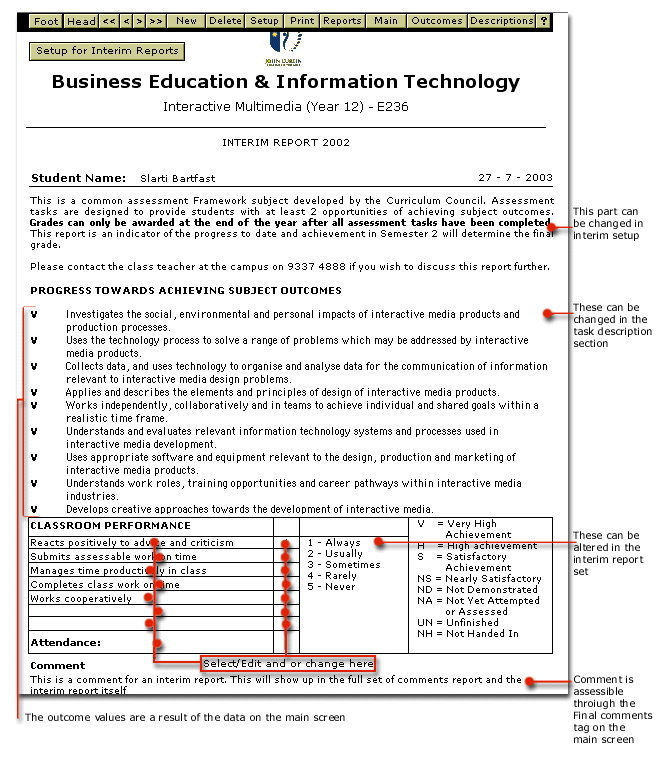
Fig 19
There are a variety of places that you can set up certain sections of the software.
They are:
These screens look like the following:
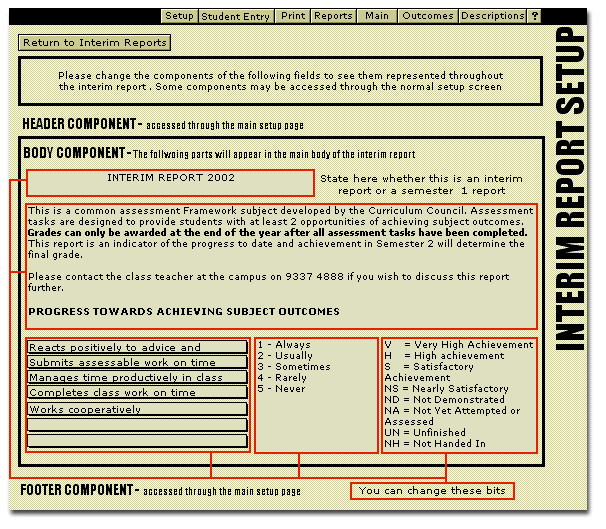
fig 20
Overall setup TOP
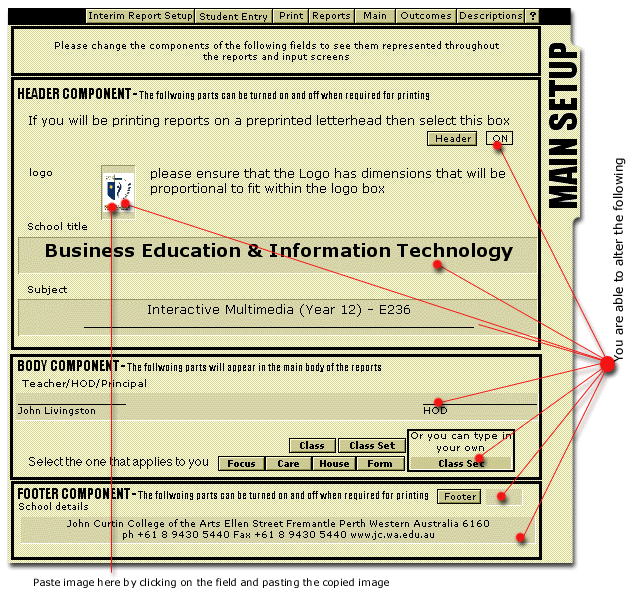
fig 21
To see changes in the header and the footer you need to turn them off then on again. You can also turn the headers and footers off when printing a report. You will see a couple of buttons that look like the following when in a report:
![]() Use these to turn
the headers and footers on or off when printing on pre-printed stationary
Use these to turn
the headers and footers on or off when printing on pre-printed stationary

fig 22
Outcomes setupTOP
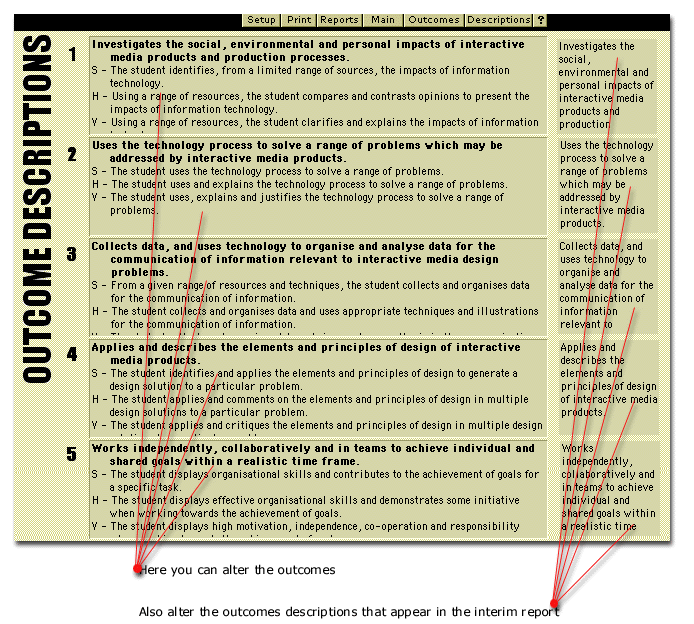
Formatting the outcomes is important as the reports import the format of your text into the report. Hopefully you will not have to do too many changes here. These outcomes were gathered from Curriculum Council.
fig 23
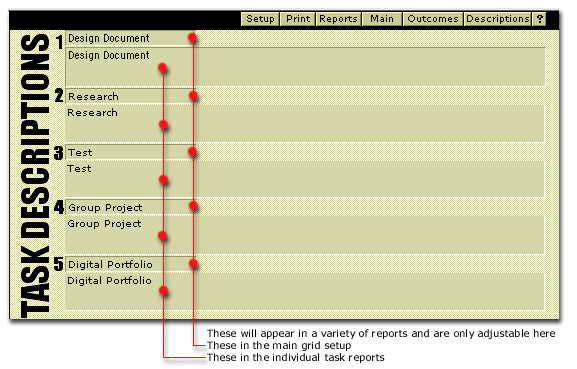
fig 24
These task descriptions are for you to adjust and change as necessary. You
may not need to change any of them at all. However, the larger of the 2 boxes
for each task, appears in the task report. It would be beneficial to give
a description of more than just a couple of words. The smaller field is used
throughout different screens including the Main screen and Grid and Comment
Report.
Left over screen shots TOP
When writing comments for the interim report and the final comment you should select the 'Final Comments' tag from the main screen

You should receive the following screen
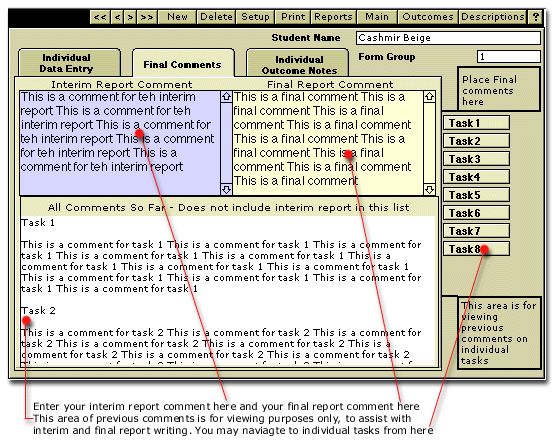
fig 25
Please
note the instructions indicated by ![]() .
.
When printing you will print from one of two options.

fig 26
![]() The help button will give you a screen that gives a description of the menu
bar and some extra details about the software.
The help button will give you a screen that gives a description of the menu
bar and some extra details about the software.
When sorting records there are a couple of things you may wish to do.
1. Find records based on a certain criteria. E.g. you might want to find all students that belong to a certain class set and print the overall marks for that class.
2. You just may want to sort the class into a specific order. Be it alphabetically by first or lastname. Perhaps by grade or class set. But still have all records available.
Lets go over the first sort/search:
We will start off by deciding what it is we want to find. For this example I want to find all students from class set 1 that have an “A” grade. I can use any of the available screens to do the search, but the easiest way is to use a screen that has the data on it. In this case I need a screen that displays both the class set and the grade. This could either be the “Main” screen (fig1), the “Final Outcomes with Grades” report (fig15) or the “Final Grid with Comment” report (fig16). I will use the “Final Outcomes with Grades” because the result will be a list of all the students required.
Using the 'Final Outcomes and Grades' screen as a guide do the following:
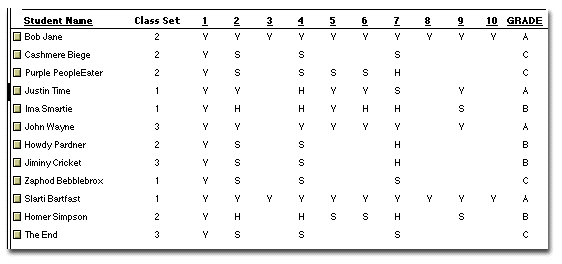
fig 27
Whilst
in this screen press CTRL+F (for PC) or
![]() +F (for
Mac)
+F (for
Mac)
You will a get a screen with blank fields such as this:

fig 28
Enter the data you are searching for into the appropriate fields.
e.g. put 1 in 'Class Set' and an A in 'Grade'

fig 29
Then press Enter/Return on the keyboard.
This is the result of the search/query

fig 30
You can then navigate through the system only using these results as your data.
Note that you can see that we have 2 records available from a possible 12 by looking at the status bar to the left.

fig 31
To
get all the records back press CTRL+J (PC) OR ![]() +J (Mac)
+J (Mac)
Now lets go over the second sort technique:
The
quickest way is to use a variety of screens that have sort buttons already
on them. These buttons look like this: ![]()
Once you have sorted the data, the data stays sorted until you resort it or add more records. This is the safest and easiest way to sort (recommended).
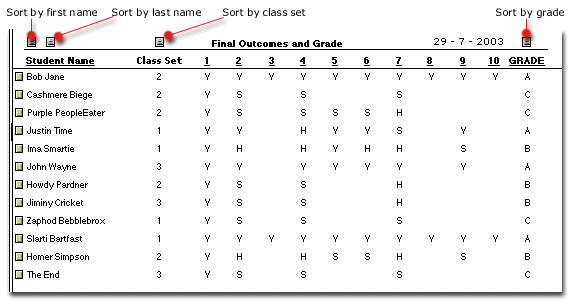
fig 32
Example after sorting by grade
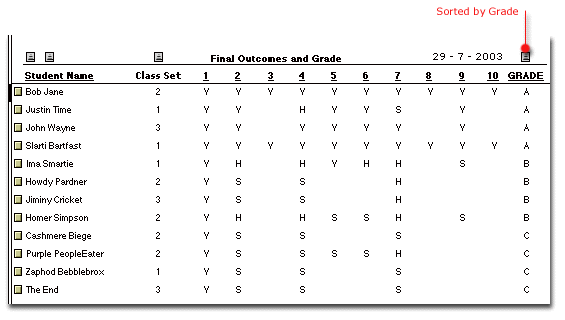
fig 33
Drop Down Menus TOP
A couple of drop down menus that need explaining are the 'Records' and 'View' menu available on the TOP menu bar.
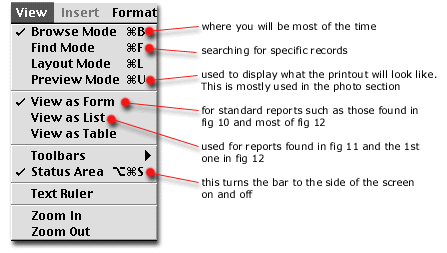
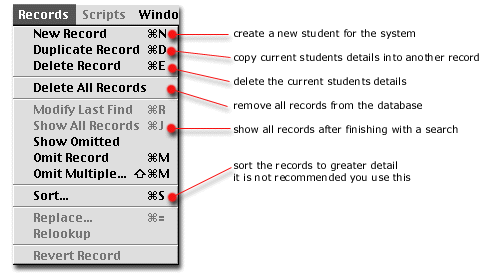
fig 36
Contact
Details:
TOP
Craig Blair
Computer Consultant
ABN: 50 844 805 674
Phone: (08) 9364 1448
Email: blair_craig@yahoo.com.au
Orders:
The software is sold on a standard per subject basis at a current rate of
$39.95 (inc GST)per subject.
Specially required non-standard units start at $49.95 (inc GST)
Orders can be made by mail (above address) using the attached order form or
school order form, phone or by email (above email recommended).
You should state the module required with subject name and Curriculum Council
code and whether it is for Mac or PC.
Payment is by cheque only.
All cheques are to be made payable to:
Craig Blair – Computer consultant
Installation TOP
Macintosh install
PC install